
Sending a survey is just the beginning. The real value lies in understanding who engaged, how they responded, and what the data is telling you. OnSurvey added two powerful capabilities 1) Survey Metrics for engagement visibility and 2) Survey Response Analytics for analyzing response intelligence.
Before you can act on feedback, you need to know if people are actually engaging. OnSurvey’s Metrics feature gives HR teams a clear, real-time overview of every survey’s reach and participation.
For each survey, Metrics surfaces:
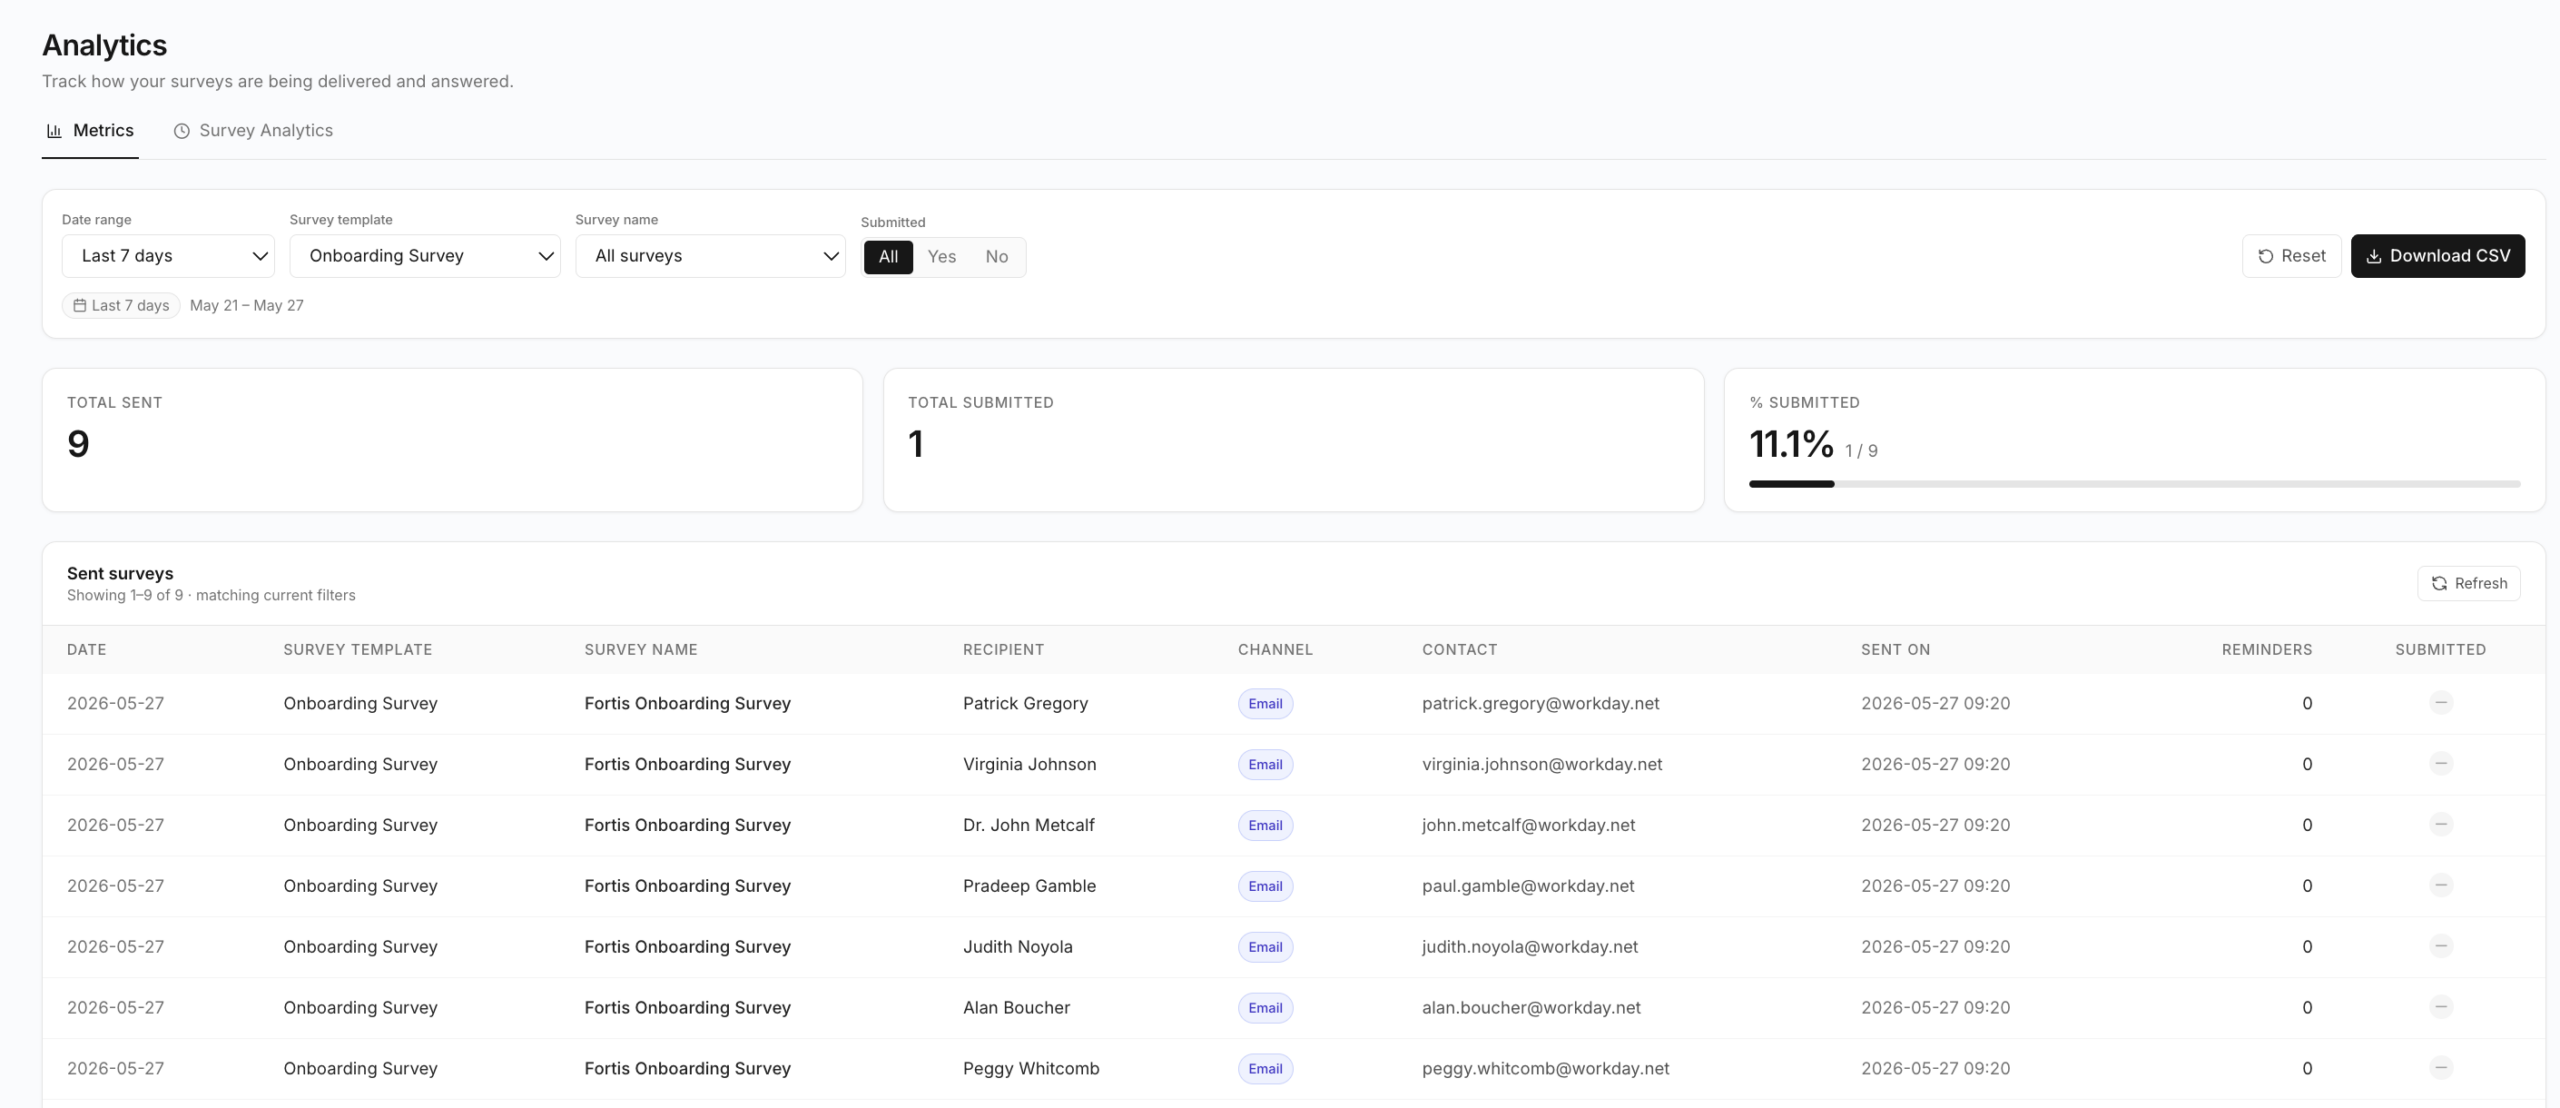
Together, these data points give you a complete picture of survey engagement.
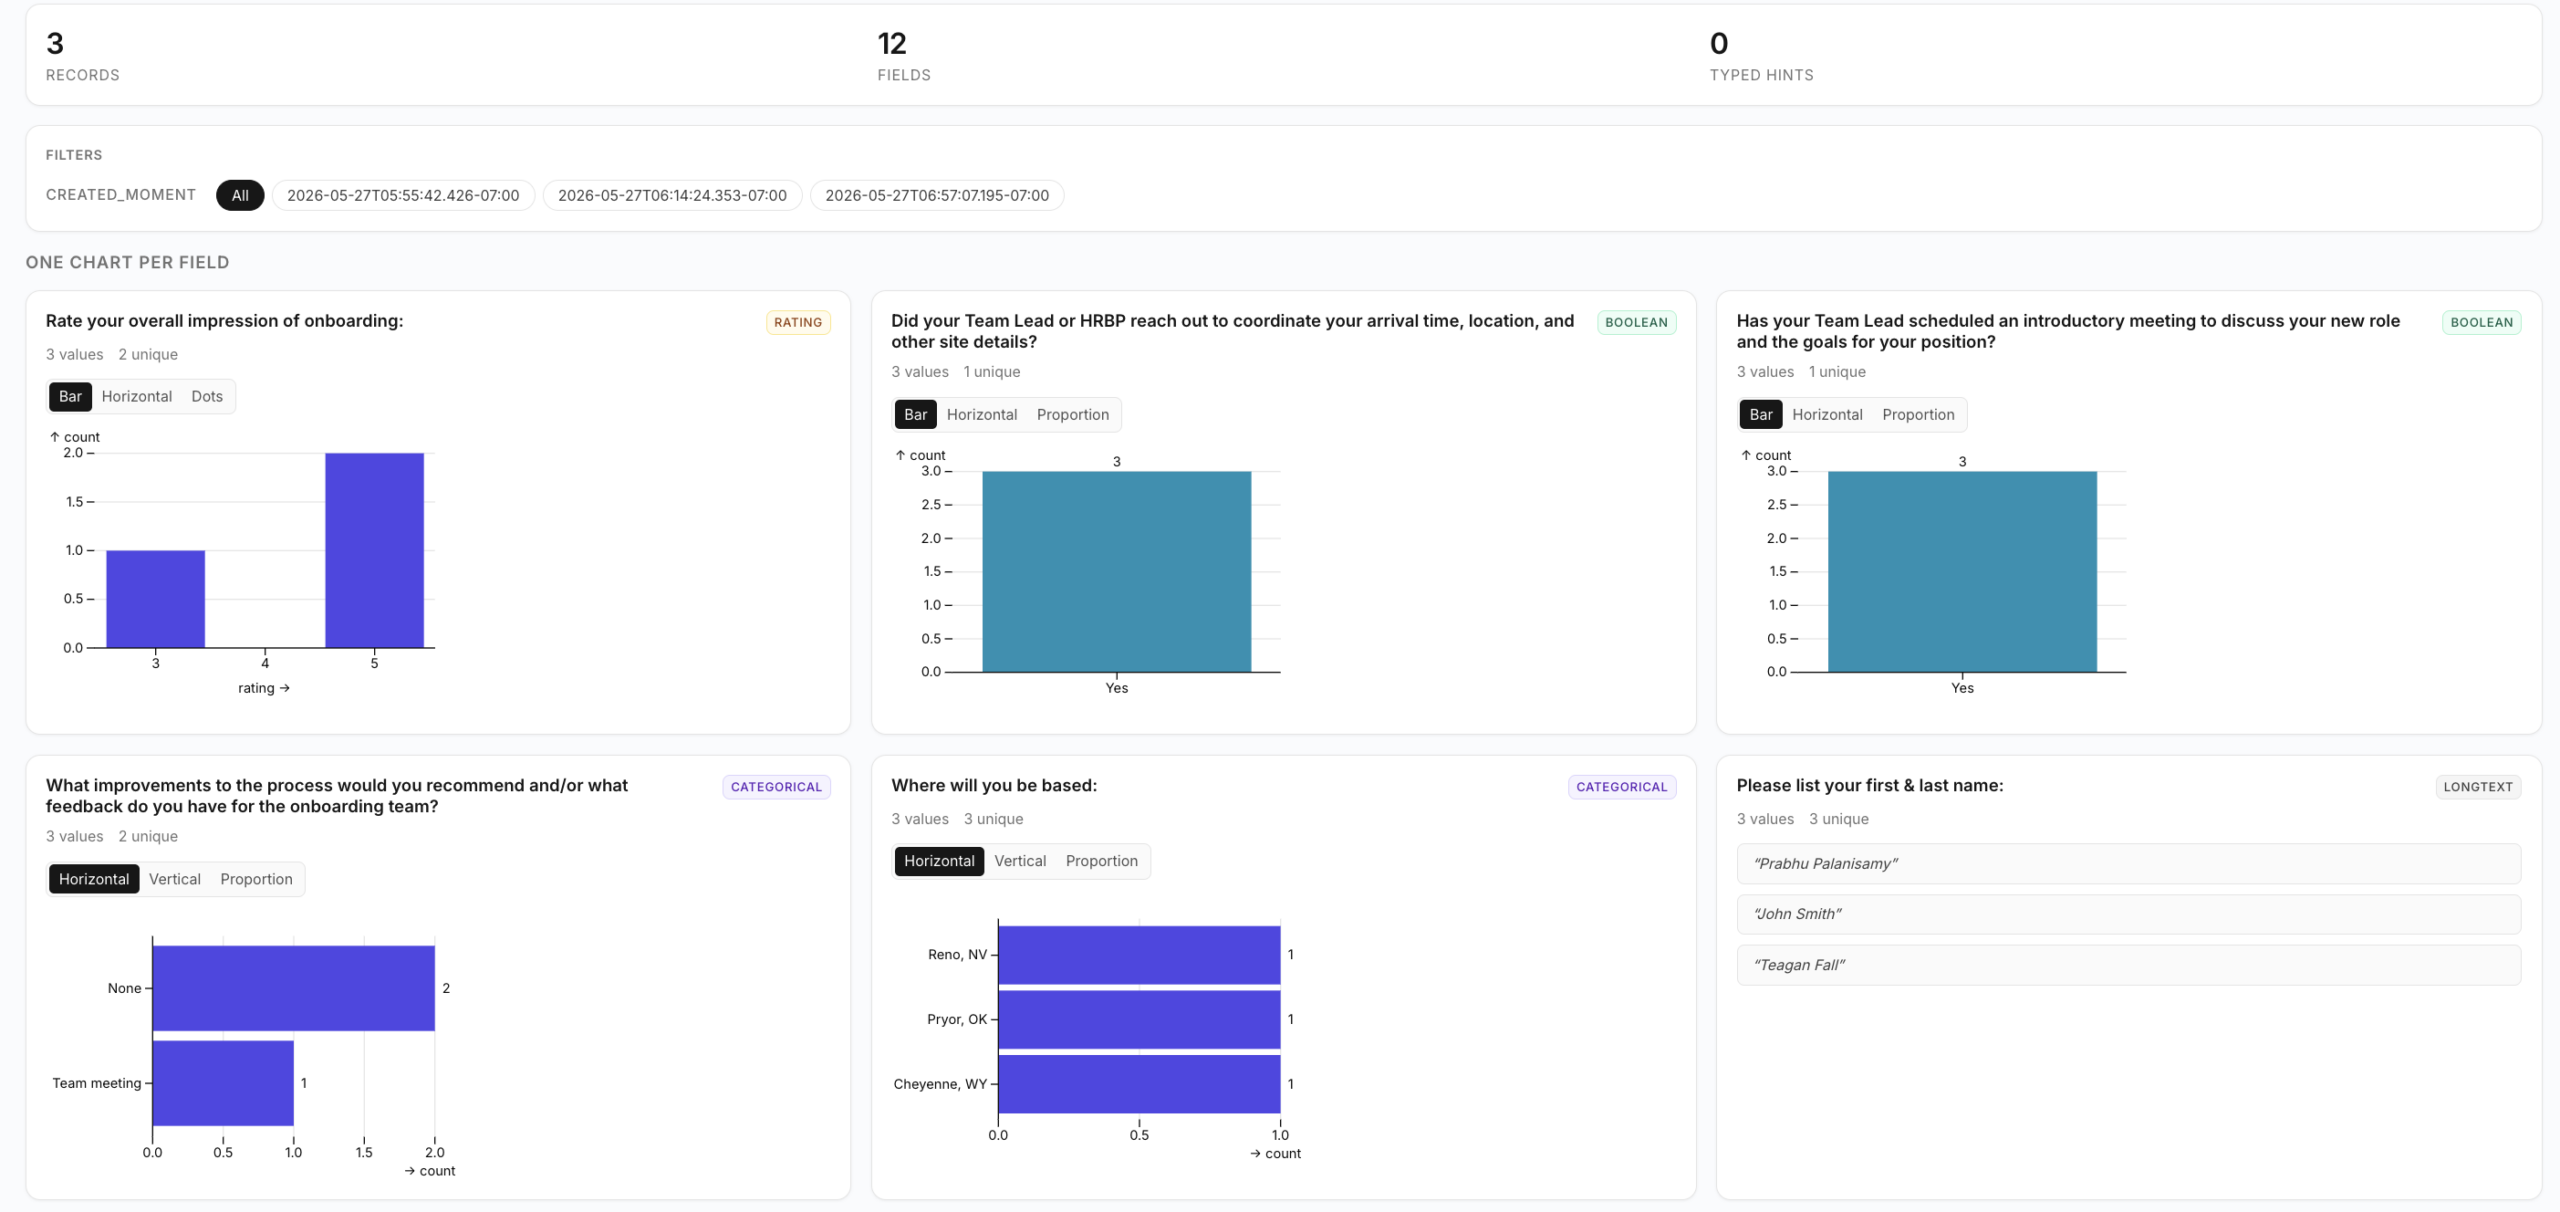
Once responses come in, the next challenge is making sense of them. OnSurvey’s Response Analytics transforms raw Workday survey data into visual, actionable dashboards.
Here’s how it works:
Responses live in Workday. Every survey response is stored natively in Workday. Your data stays where it belongs.
OnSurvey reads via Workday Custom Reports. Using a Workday RaaS (Report as a Service) Advanced Custom Report, OnSurvey reads survey response data directly from Workday. You configure the report once using the OnSurvey “Survey Responses” data source, and OnSurvey handles the rest.
Auto-rendered dashboards, zero manual setup. The analytics feature ingests a Workday RaaS custom report and auto-renders a dashboard of charts.
Flexible and filterable. Want to drill into a specific survey? Add a filter on your custom report to scope responses to a single survey. You can also add additional fields to your report to segment analytics by department, location, or any other Workday attribute.
Getting Response Analytics running takes just a few steps:
OnSurvey auto-detects the schema and renders your dashboard instantly. Full configuration details are available in the OnSurvey documentation.
Most survey tools integrate with Workday. OnSurvey is built on Workday. That means:
For enterprise HR teams, that’s not just a convenience. It’s a compliance and governance advantage.
If your organization runs on Workday and you’re ready to go beyond basic survey completion rates, OnSurvey gives you the metrics and analytics to truly understand your workforce.
 Book a demo at onwardb.com See Survey Metrics and Response Analytics live in your Workday tenant.