Every year, more than 25% of first-year students leave college, and over one in three never complete a degree. Behind those numbers is a feedback gap: institutions often learn about student dissatisfaction too late — after a student has already disengaged, dropped a course, or left entirely. With over 400 Higher Ed institutions worldwide use Workday Workday Student, the opportunity to close that gap with timely, native surveys has never been greater.
This article explores the top student survey use cases, the challenges institutions face today, and a step-by-step guide to implementing a Student Course Completion Survey using OnSurvey.
The most widely used survey in higher education. Course completion surveys capture student feedback on instruction quality, course content, workload balance, and learning outcomes immediately after a course ends. These evaluations directly inform faculty development, curriculum revisions, and accreditation reporting.
First impressions matter. Orientation surveys measure how well new students are integrating whether they understand registration processes, feel welcomed by their department, and have the resources they need. Collecting this feedback within the first two weeks allows institutions to intervene early and improve the first-year experience.
Rather than waiting until the end of the term, mid-semester pulse surveys give instructors a real-time read on how students are experiencing a course while there is still time to adjust. These short, focused surveys (three to five questions) can surface issues with pacing, clarity, or workload before they become reasons to drop.
Academic advising, financial aid, and career services are critical touchpoints in the student journey. Surveying students after key interactions e.g an advising session, a financial aid decision, a career workshop provides operational feedback that helps institutions improve service delivery and staff performance.
Institutions need to understand what happens after graduation. Alumni surveys track employment outcomes, graduate school enrollment, and the perceived value of the education received. This data supports accreditation, marketing, and program development.
Despite the clear value of student feedback, most higher education institutions struggle with survey programs that are fragmented, low-response, and disconnected from the systems where decisions are made.
When evaluating survey solutions for Workday Student, the architectural choice between a Built-On Workday app and a third-party integrated tool has significant implications for data flow, security, administration, and user experience. The table below compares the two approaches across the dimensions that matter most to higher education institutions.
| Dimension | Built-On Workday (OnSurvey) | Integrated Third-Party Tool |
|---|---|---|
| Data Residency | All survey responses stored natively inside Workday. No external databases or data exports required. | Responses stored in vendor’s cloud environment. Data must be synced or exported to Workday. |
| Security & Compliance | Inherits Workday’s role-based security model, encryption, and audit trail. | Requires separate security configuration. Data in transit between systems introduces additional risk. |
| User Experience | Students and administrators access surveys within the same Workday interface they already use for registration, grades, and financial aid. | Students are redirected to an external URL or application. Context-switching reduces completion rates. |
| Automation & Triggers | Surveys triggered automatically by Workday business process events (course completion, enrollment change, academic milestone). | Triggers require middleware (ISU, EIB, or custom integration) to pass events from Workday to the survey tool. |
| Reporting & Analytics | Survey data available in Workday reporting, Worksheets, and Prism Analytics alongside enrollment, grade, and retention data. | Separate reporting environment. Combining survey data with SIS data requires manual exports or a data warehouse. |
| Administration | Single admin console within Workday. No separate vendor portal to manage users, permissions, or templates. | Separate admin portal with its own user management, SSO configuration, and license tracking. |
| Deployment & Updates | Deployed through Workday Marketplace. Updates align with Workday release cycles. No integration maintenance. | Requires ongoing integration maintenance. API changes on either side can break data flows. |
| Total Cost of Ownership | Lower. No integration development, no middleware licensing, no separate data storage costs. | Higher. Integration build, middleware, separate license fees, ongoing maintenance, and support contracts. |
| Time to Value | Days to weeks. Configure templates, set triggers, go live. | Months. Integration scoping, development, testing, and UAT before first survey is sent. |
| Mobile Experience | Native Workday mobile app support. Surveys render natively on mobile devices. | Depends on vendor’s mobile capabilities. May require a separate mobile app or browser redirect. |
The course completion survey is the single most impactful survey a higher education institution can run. Done well, it produces structured, timely feedback that informs instruction, supports accreditation, and signals student engagement risk.
An effective course completion survey should capture feedback across four key dimensions:
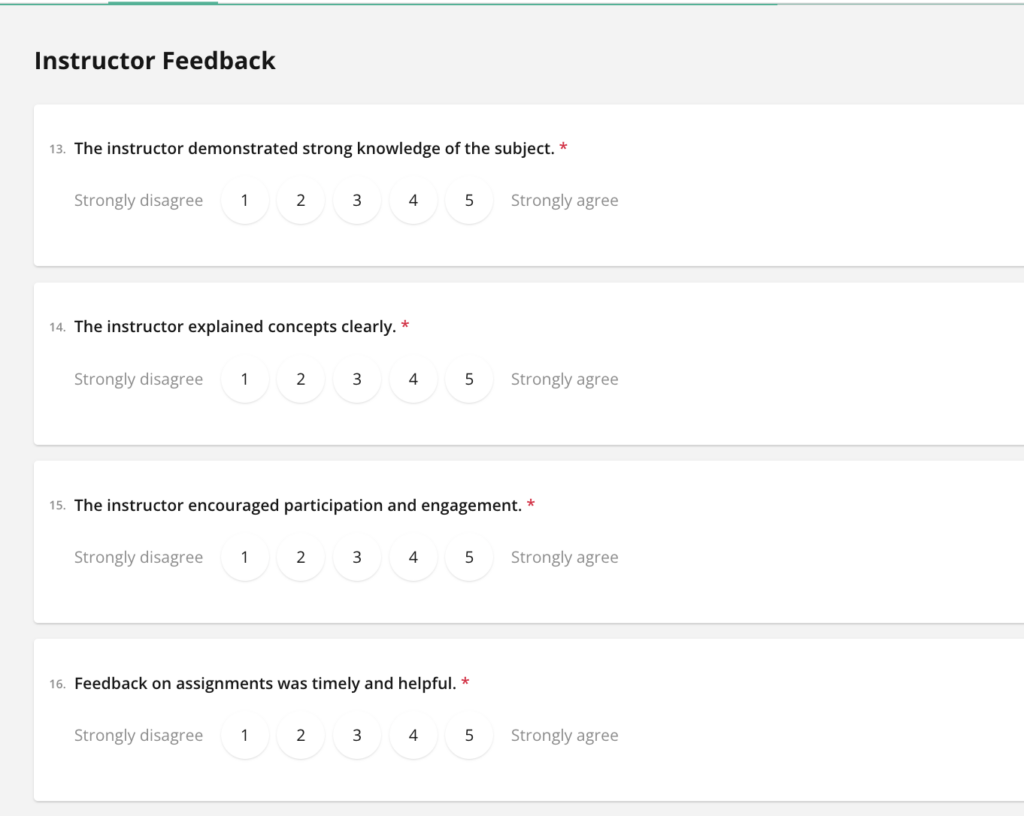
Instructional Effectiveness. Did the instructor communicate clearly? Were learning objectives met? Was the instructor responsive to questions and accessible outside of class? These questions directly support faculty development and tenure review processes.
Course Design and Content. Was the course well-organized? Were assignments aligned with stated learning outcomes? Was the difficulty level appropriate? Were the materials (textbooks, readings, digital resources) useful and current? This data drives curriculum revision.
Student Engagement and Workload. How many hours per week did students spend on coursework outside of class? Did they feel challenged but not overwhelmed? Did they participate in discussions, group work, or office hours? Engagement metrics are strong predictors of retention.
Overall Satisfaction and Net Promoter. Would the student recommend this course to a peer? How would they rate the overall learning experience? e.g A simple net promoter question on a scale of 0 to 10, how likely are you to recommend this course.
Instructional Effectiveness
Course Design and Content
Student Engagement and Workload
Overall Satisfaction
OnSurvey is a built-on Workday app that enables users to create, send and analyse surveys within Workday. It eliminates the integration overhead, security gaps, and data silos that come with external tools. Below is a step-by-step walkthrough of how to implement a Student Course Completion Survey using OnSurvey within your Workday Student environment.
The OnSurvey Designer provides a drag-and-drop interface for building surveys directly inside Workday. No external tools, no separate login, no coding required.
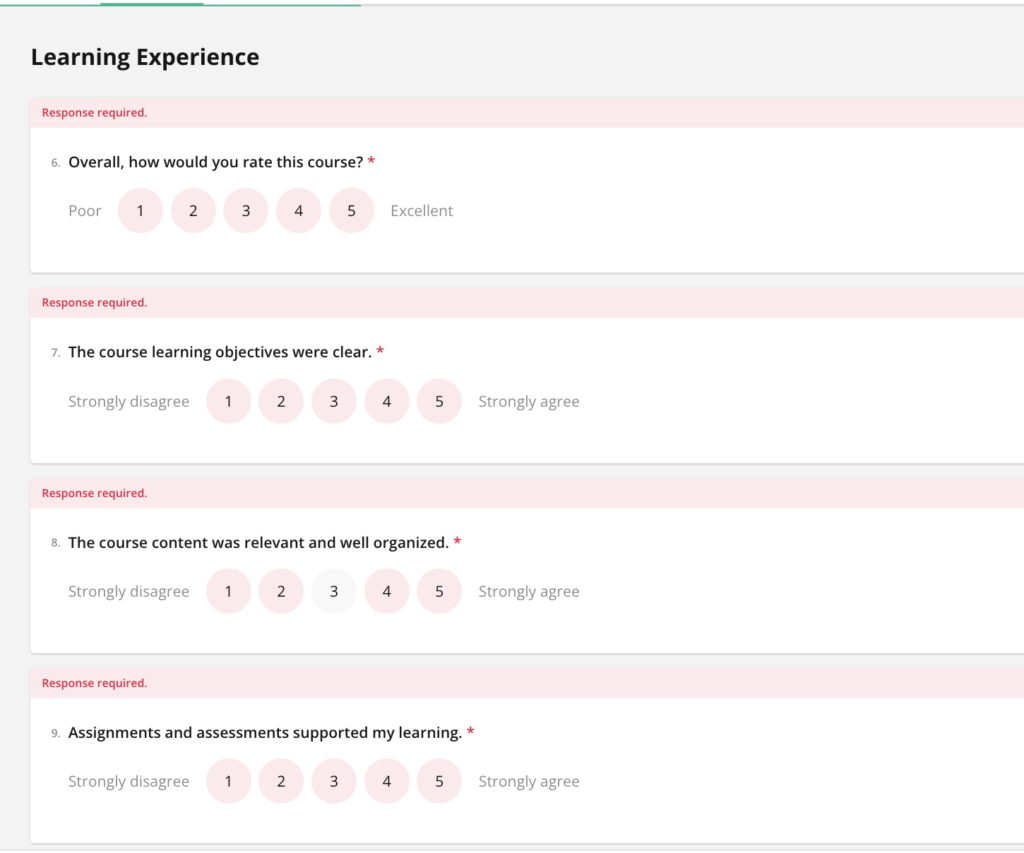
Start with a template. OnSurvey includes pre-built survey templates that you can customize. For a course completion survey, start with the feedback template and modify it with your institution’s specific questions. This accelerates design from days to minutes.
Use a mix of question types. Combine Likert-scale questions (for quantitative benchmarking), single-select dropdowns (for categorical data like hours spent), and one or two open-text fields (for qualitative insight).
Keep it to 10–12 questions. Research shows that surveys exceeding 15 questions see a significant drop in completion rates. Every question should map to a specific decision or action the institution will take with the result.
Write clear, neutral questions. Avoid leading language (“How excellent was your instructor?”) and double-barreled questions (“Was the instructor knowledgeable and approachable?”). Each question should ask about one thing.
Preview and test on mobile. More than half of students will complete the survey on a phone. Use the OnSurvey preview feature to verify that questions render cleanly and that the survey can be completed in under five minutes on a mobile device.
One of OnSurvey’s most powerful features is event-based automation.
Configure the trigger event. In the OnSurvey trigger configuration, select the Workday business process event that should initiate the survey. For a course completion survey, this is typically the course section completion or grade posting event. When the event fires in Workday, OnSurvey automatically sends the survey to the relevant students.
Define the audience. Use Workday security groups and population filters to ensure the survey reaches the right students. For example, you may want to survey all students enrolled in a course section, or only those who completed the course (excluding withdrawals). OnSurvey inherits Workday’s role-based security, so you can define audiences using the same groups and filters your institution already manages.
Set the timing window. Configure when the survey opens (for example, one day after final grades are posted) and when it closes (for example, 14 days later). A tight window creates urgency. OnSurvey allows you to configure automatic reminders at intervals you define — for example, a reminder at day 3, day 7, and day 12.
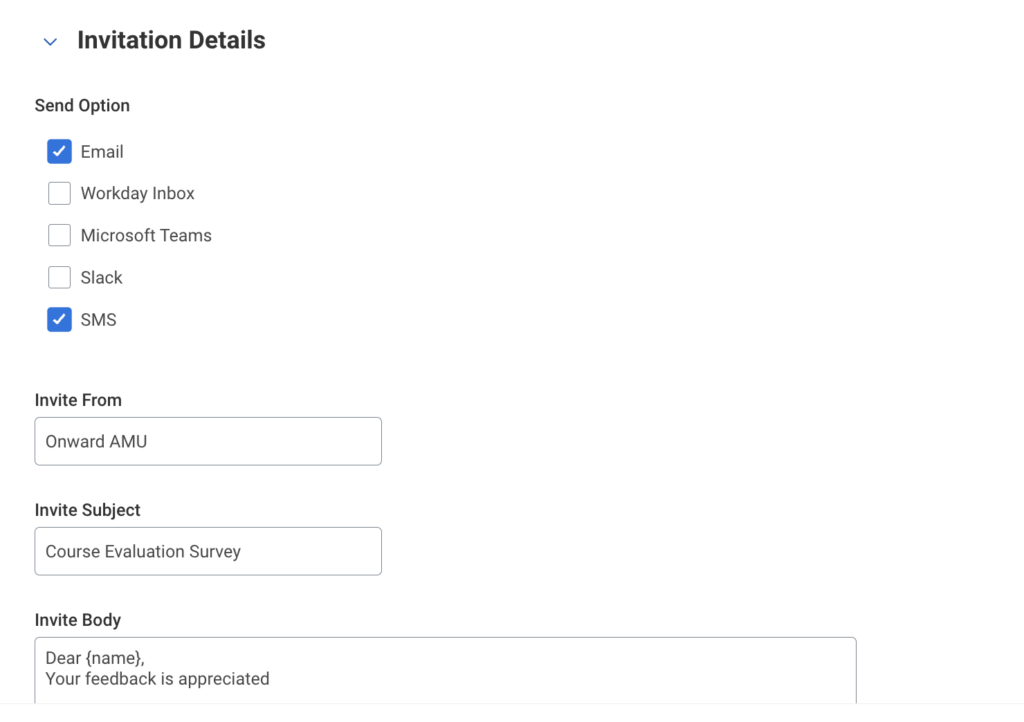
Choose delivery channels. Select how the survey will reach students: Workday inbox, email, mobile push notification, Slack, or Microsoft Teams. Multi-channel delivery ensures students encounter the survey in the tool they use most.
![]()
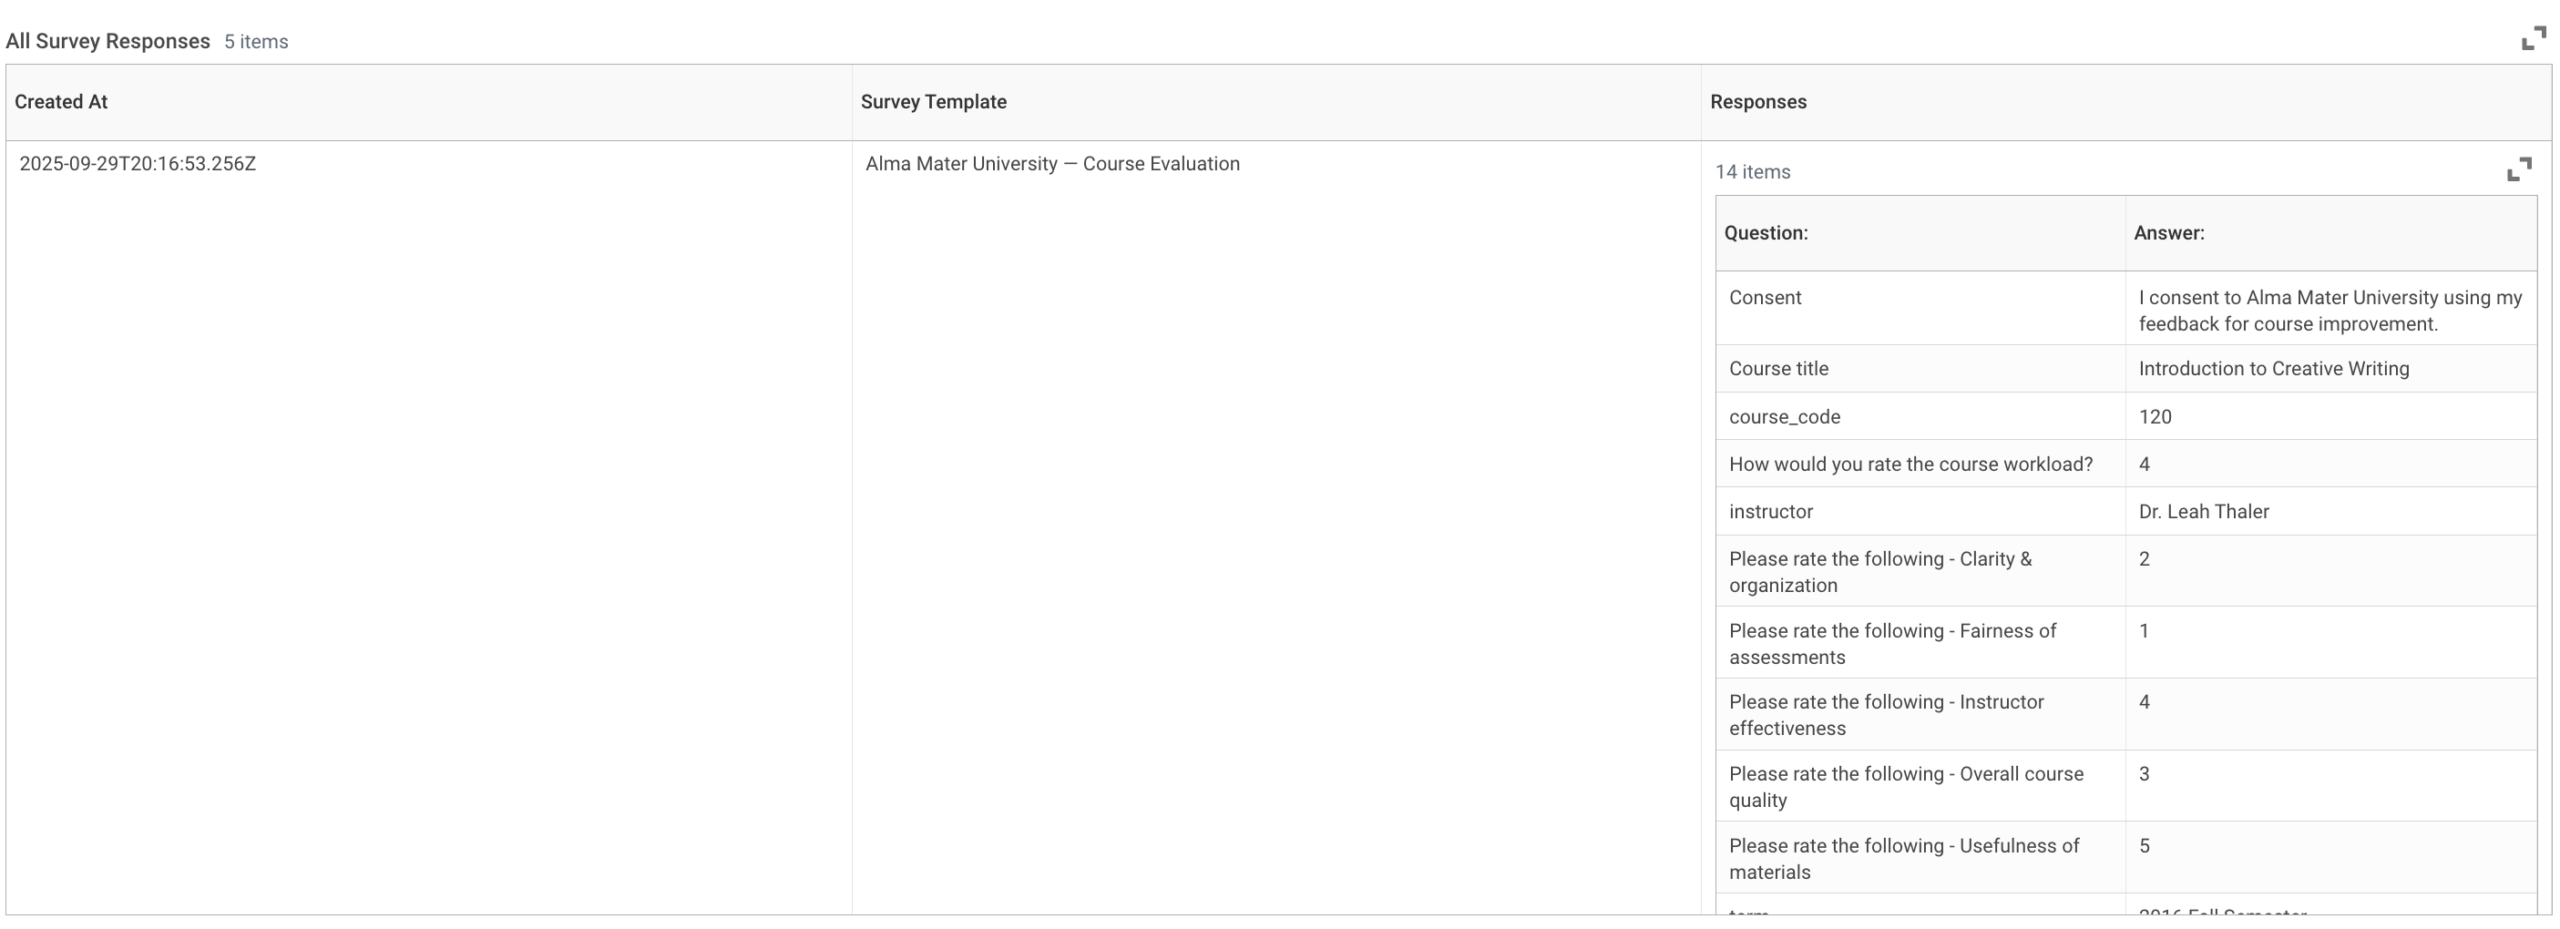
Once the survey is live, responses flow directly into Workday. No external database, no data export, no middleware required.
Response data in Workday. All responses are stored natively in Workday. This means they are immediately available for reporting in Workday Reports, Worksheets, and Prism Analytics alongside enrollment, grade, retention, and demographic data. No ETL pipeline, no CSV export, no separate BI tool required.
OnSurvey delivers surveys where students already are, triggers them automatically from Workday business processes, stores every response inside Workday’s secure environment, and makes the data available instantly through the reports and analytics tools your institution already uses. The result is higher response rates, better data, faster insights, and a direct line from student feedback to institutional action.
If your institution runs Workday Student and you are ready to replace fragmented survey tools with a native, secure, automated solution, OnSurvey is built for exactly this.
 Request a Demo of OnSurvey — See how OnSurvey works inside your Workday environment with a live, personalized walkthrough.
Visit OnSurvey on Workday Marketplace — Learn more and start your evaluation today.
OnSurvey is a built-on Workday application that enables Workday users to create, send and analyze surveys within Workday. All your surveys, responses, and analytics are all within the Workday platform your institution already trusts.